If you’ve managed to make it to this page, let me first say I’m sorry and offer a warning: This title is not clickbait, it does get worse from here, turn back now. For those of you willing to stick around and enjoy the Nathan Fielder-esque comedy that is relying on Google Sheets for mission-critical device monitoring, we’ll begin with a project overview.
Beginning The Project
The genesis of this project began where all problems begin: the helpdesk. In the scramble to grow, this up-and-coming startup had begun issuing too many devices too quickly. An MDM had been implemented, to allow for basic remote monitoring, but no actionable diagnostic information was accessible from the platform. This created the repetitive dance of scheduling calls with customers to remote in, and manually chase down the important data needed to resolve a problem.
On average, most tickets would open with a vague issue, in need of further analysis. The technician would schedule a call to take a look at the machine via a remote desktop solution, which would usually take about 20-30 minutes. The call would generally be scheduled for an hour or two out, and last around 30 minutes, possibly requiring a second call. I found this process was, on average, taking about half a day to reach a resolution with the user, requiring a not insubstantial amount of end-user, and technician involvement.
After defining the problem with those metrics, I began to look into what workflows would allow me to better utilize that time, by identifying the following pain points:
- The process takes too long.
- There is too much technician, and end user involvement.
- Much of this process is repeated exactly for each case (Task Manager, Event Log, etc).
- Collaboration with other technicians is not possible when data is only accessable live.
- Technician cannot proactively access diagnostic information.
- Some information is not easily accessible from the native GUI (CPU Temp, Battery Info, Connected Devices)
Identifying a Workflow
Based on those pain points, I identified the following objectives:
- The process takes too long.
- The process should take no more than 5 minutes.
- There is too much technician, and end user involvement.
- The process should be able to be performed remotely, without end user involvement.
- Much of this process is repeated exactly for each case (Task Manager, Event Log, etc).
- The process should automate gathering common information that would be helpful for every case.
- Collaboration with other technicians is not possible when data is only accessable live.
- Data should be stored remotely in a format that can be easily shared and archived.
- Technician cannot proactively access diagnostic information.
- The process should be able to run on any device at any time without showing any indication on an end user device.
- Some information is not easily accessible from the native GUI (CPU Temp, Battery Info, Connected Devices)
- Solution should automatically pull information that may not be accessible easily, or at all through native GUI interfaces.
To achieve this, my idea was to use our existing MDM to run a silent PowerShell script that would collect this data, and push it to a Google AppScript endpoint, that would translate it into a human-readable Google Sheet that could be shared by the team.
To assist in the expedited diagnosis of issues, I also decided to create a dashboard sheet that could display the most important parts of the collected data all at once, in addition to some useful information like progress bars to show minimum and maximum values, calculated values based on collected data, pictures of the device, and a table that dynamically recognizes common issues found in the diagnostic data, and displays them in a warning table to quickly direct the technician towards potential issues. The data I wished to collect include:
- System, application, and security event logs from the past 10 days.
- All hardware related WMI objects.
- Connected USB devices.
- Connected display adapters.
- Network and disk activity.
- Windows environment information.
Collecting the Data
The first step in this process would be to design a script that would collect all the necessary data to provide to the AppScript endpoint. I’ve selected PowerShell, as it’s the most extensible standard shell in Windows, and it can be remotely called via an existing MDM. To start, we’ll address the WMI Objects.
A WMI Object is a series of handles provided by Windows to obtain various information about the device, and Windows environment. These classes, offer a wealth of information about the system and are easily accessible via PowerShell. A complete reference for all current WMI Classes can be found on the official Microsoft Windows documentation.
Here is the basic syntax to retrieve the data from a WMI Object. In this case, I’ve chosen the Win32_OperatingSystem object:
Get-WmiObject "Win32_OperatingSystem"Which returns a single object with the following properties.
SystemDirectory : C:\Windows\system32
Organization    :
BuildNumber     : 19041
RegisteredUser  : Admin
SerialNumber    : XXXXX-XXXXX-XXXXX-XXXXX
Version         : 10.0.19041
Keep in mind that while this particular class only returns a single object, some classes will often return more than one object. This will require special handling later.
We can also selectively choose which properties we’d like to return, to limit unnecessary data being recorded and uploaded, by piping the output of the Get-WmiObject command into the Select-Object command, as shown below:
Get-WmiObject "Win32_OperatingSystem" | Select-Object -Property RegisteredUser,Version,BuildNumberWhen using the Select-Object command, the output will be formatted differently, but return the same data. This is because the conversion to text happens after the command is run, by PowerShell, and not by the command itself.
RegisteredUser Version    BuildNumber
-------------- -------    -----------
Admin          10.0.19041 19041
Encoding the Data
Now that we have this information, we need some way to encode it for the endpoint we will write later. The current output isn’t particularly easy to parse, so we should convert the output into a more standard format. For this project, I’ve chosen CSV, as it’s already built into PowerShell and has all the options we need.
We’ll continue building on the previous command by piping those objects into the Export-CSV command, but I’m going to change the WMI class I am pulling from to one that returns multiple objects to better illustrate the output format.
Get-WmiObject "CIM_USBDevice" |
Select-Object -Property Name,DeviceID,Status |
Export-CSV -Path "$($env:TEMP)\USBDevices.csv" -Force -NoTypeInformation -Delimiter '`'
Before we run this command, let’s review the command flags on the Export-CSV option:
- Path
- This flag sets the ouput file of the CSV export. We’re writing to a file for all of our outputs, as it is enough data to require being stored on disk before export. We don’t want these files to persist, or be visible to the user, so I am using a PowerShell formula
"$($env:TEMP)\USBDevices.csv"to ensure the data is being stored somewhere volatile, and out of view from the user.
- This flag sets the ouput file of the CSV export. We’re writing to a file for all of our outputs, as it is enough data to require being stored on disk before export. We don’t want these files to persist, or be visible to the user, so I am using a PowerShell formula
- Force
- This flag forces the command to write the file, even if the path does not exist, or if the file already exists. We don’t care about overwriting data here, as it will immediately get pushed to our endpoint, so this is fine.
- NoTypeInfomation
- By default, this command will add a class descriptor to the head of the CSV file. This will cause issues with the CSV parsing, so we add this command to suppress it.
- Delimiter
- This changes the delimiter to the following character, in this case, the grave (`) character. The comma character would conflict with existing commas in certain objects we hope to encode, like event logs. As grave is a very uncommon character, this mitigates the problem almost entirely.
We can view the output by importing the file %temp%/USBDevices.csv into Excel. To properly represent the data, you must import the file with the custom delimiter “`”. A truncated example output can be seen below:
| Name | DeviceID | Status |
|---|---|---|
| USB Composite Device | USB\VID_046D&PID_085E\8650EA19 | OK |
| USB Composite Device | USB\VID_08BB&PID_2902\5&36455203&0&7 | OK |
| Generic USB Hub | USB\VID_0BB4&PID_2134\6&11DC7D2D&0&1 | OK |
| USB Printing Support | USB\VID_0424&PID_274E\6&11DC7D2D&0&3 | OK |
Pushing the Data
Next, we need to gather up all these files in a single PowerShell object that can be passed to the endpoint we’ll be writing to upload all the data to. My approach was to create a global object that each CSV file can be added to. I’ll also be adding an additional flag to each file called “flip”. For each class expected to return only a single object like Win32_OperatingSystem, this flag will instruct the endpoint to flip the rows and columns of the dataset for ease of readability and querying.
This is the global object that I will push each CSV into. There is a files property that the endpoint can iterate through to discover the keys of each WMI class, the flip flag, and a single static key to indicate the machine hostname.
$CSVs = @{files='';flip='';hostname=$(hostname)};For ease of readability, I’ve created a function to take care of pushing the finished CSV into the object with a simple pipe.
function Push-CSV{

  param(
    [Parameter(ValueFromPipeline = $true)]
  	$CSV,
    $Name,
    $Flip
  )

  if($CSVs."files" -ne ""){
    $CSVs."files" += ",";
  }
  $CSVs."files" += $Name;

  if($CSVs."flip" -ne ""){
    $CSVs."flip" += ",";
  }
  if($Flip -eq 1){
    $CSVs."flip" += 1;
  }else{
    $CSVs."flip" += 0;
  }

  $CSVs.Add($Name,$CSV);

}
To call this function, we can use the following syntax:
Get-content "$($env:TEMP)\USBDevices.csv" -Raw | Push-CSV -Name "USBDevices" -Flip 0To aid in readability, I’ve wrapped this entire process in a function, to allow for a single command with a WMI class to automatically gather, and queue the data to be uploaded.
function Queue-Data{

  param(
  	$Name,

    $Properties,
    $Flip
  )

  if($Properties -eq ""){
    Get-WmiObject $Name |
    Export-CSV -Path "$($env:TEMP)\$($Name).csv" -Force -NoTypeInformation -   Delimiter '`'
  }else{
    Get-WmiObject $Name |
    Select-Object -Property $Properties |
    Export-CSV -Path "$($env:TEMP)\$($Name).csv" -Force -NoTypeInformation -   Delimiter '`'
  }

  Get-content "$($env:TEMP)\$($Name).csv" -Raw | Push-CSV -Name $Name -Flip $Flip

}
I’ve written a similar, but slightly modified function specifically for exporting event logs and processes, shown below:
function Export-EventLogs{

  param(
    $LogName,
    $Fields,
    $From
  )

  Get-EventLog -LogName $LogName -After $From | Select-Object -Property $Fields | Export-CSV -Path "$($env:TEMP)\$($LogName)EventLog.csv" -Force -NoTypeInformation -Delimiter '`'
  Get-content "$($env:TEMP)\$($LogName)EventLog.csv" -Raw | Push-CSV -Name "$($LogName)EventLog" -Flip 0
  echo "Exporting $($env:TEMP)\$($LogName)EventLog.csv";
}function Export-Processes{
Get-Process | Select-Object -Property Name,Description,Product,Company,CPU,@{Name='WorkingSet';Expression={($_.WorkingSet/1KB)}},StartTime,Responding,Id,ProductVersion | Export-CSV -Path "$($env:TEMP)\Processes.csv" -Force -NoTypeInformation -Delimiter '`'
Get-content "$($env:TEMP)\Processes.csv" -Raw | Push-CSV -Name "Processes" -Flip 0
echo "Exporting $($env:TEMP)\Processes.csv";
}Finally, we need to push our generated object to the AppScript endpoint. After collecting each object/log you’ve selected, the following function will pass the root object in a post request to our endpoint.
function Send-Data{

  echo "`nPushing data to API...`n";
  $url = "https://script.google.com/macros/s/XXXXXXXXXXXXXXXXXXXXX/exec";
  $Response = Invoke-WebRequest -Uri $url -Method POST -Body $CSVs -UseBasicParsing
  echo "`n`nView Generated Report At:`n";
  echo $Response.Content;
}
This command is run at the end of the script following the data collection.
AppScript Endpoint
Now that all this information has been collected, we need an endpoint that can capture it, and process the data into a Google Sheet. I’ll show each function in the order it is run for simplicity. The first function is a “magic” AppScript function, that allows the endpoint to receive post requests.
var shownSheets = ["SystemEventLog", "ApplicationEventLog", "SecurityEventLog", "Processes", "Services"];
function doPost(e){

  const folderId = "XXXXXXXXXXXXX";

  var name = e.parameter.hostname+" Diagnostics "+Utilities.formatDate(new Date(), "GMT-4", "MM/dd/yyyy HH:mm:ss");
  var ssId = createSpreadsheet(name, folderId);

  var files = e.parameter.files.split(",");
  var flips = e.parameter.flip.split(",");

  for(var i = 0; i < files.length; i++){
    var fname = files[i];
    createSheetFromCSV(ssId,fname,e.parameter[fname].replace("\\", ""), flips[i]);
  }

  deleteDefaultSheet(ssId);
  injectDashboard(ssId);var i = 2;

  for(var s of shownSheets){
    var ss = SpreadsheetApp.openById(ssId);
    var currentSheet = ss.getSheetByName(s);
    ss.setActiveSheet(currentSheet);
    ss.moveActiveSheet(i);
    i++;
  }

  return ContentService.createTextOutput("https://docs.google.com/spreadsheets/d/"+ssId+"/edit").setMimeType(ContentService.MimeType.TEXT);
}
The general program flow is as follows:
- Create a Google Sheet Workbook in a shared team drive, titled “<HOSTNAME> Diagnostics <TIMESTAMP>”
- Create array of each file from the files and flip string passed in the root object
- Iterate through all files, and create a sheet in the workbook titled the name of the file, then populate that sheet with the parsed CSV, then hide the sheet
- Delete the original blank sheet in the workbook
- Copy in a premade “dashboard” sheet template, with formulas to interface with the newly created sheet data
- Hide all sheets apart from the explicitly declared names in the shownSheets variable
- Respond to the post request with a URL to the generated sheet
createSpreadsheet(name, folderID)
Firstly, we must create a new workbook to house all of our data, luckily, AppScript makes this task very simple for us.
function createSpreadsheet(name, folderId){

  var newFile = SpreadsheetApp.create(name);

  var folder = DriveApp.getFolderById(folderId);
  var ssFile = DriveApp.getFileById(newFile.getId());
  DriveApp.getFolderById("root").removeFile(ssFile);
  folder.addFile(ssFile);

  return newFile.getId();

}
I’ll skip past explaining this function in detail, as it is fairly self-explanatory.
The next step is to split the files string in the request and iterate through the newly created array. Each iteration needs to parse the data and output it to a new sheet. This is done in the createSheetFromCSV function. Given how long this function is, I’ll be breaking it down into parts.
createSheetFromCSV(ssID, sheetName, csv, flip)
The first step is to create an empty sheet and name it using the WMI class name provided to us.
function createSheetFromCSV(ssID, sheetName, csv, flip){

  var activeSpreadsheet = SpreadsheetApp.openById(ssID);

  var yourNewSheet = activeSpreadsheet.getSheetByName(sheetName);

  if (yourNewSheet != null) {
      activeSpreadsheet.deleteSheet(yourNewSheet);
  }

  yourNewSheet = activeSpreadsheet.insertSheet();
  yourNewSheet.setName(sheetName);
}
Now that we have the sheet created, we can start parsing the data provided into a 2D array. I’ve also added some logic to flip the array if the flip flag is set, before injecting this data into the sheet.
function createSheetFromCSV(ssID, sheetName, csv, flip){

  var activeSpreadsheet = SpreadsheetApp.openById(ssID);

  var yourNewSheet = activeSpreadsheet.getSheetByName(sheetName);

  if (yourNewSheet != null) {
      activeSpreadsheet.deleteSheet(yourNewSheet);
  }

  yourNewSheet = activeSpreadsheet.insertSheet();
  yourNewSheet.setName(sheetName);


  var temp = Utilities.parseCsv(csv, '`');
  var contents = new Array(temp[0].length).fill(0).map(() => new Array(temp.length).fill(0));

  if(flip == "1"){
    for(var x = 0; x < temp.length; x++){
      for(var y = 0; y < temp[0].length-1; y++){
        contents[y][x] = temp[x][y];
      }
    }
  }else{
    contents = temp;
  }

}
The next step is to actually write the data to the sheet. This is a pretty easy step for AppScript, as we’ve already formatted our data in a compatible 2D array.
function createSheetFromCSV(ssID, sheetName, csv, flip){

  var activeSpreadsheet = SpreadsheetApp.openById(ssID);

  var yourNewSheet = activeSpreadsheet.getSheetByName(sheetName);

  if (yourNewSheet != null) {
      activeSpreadsheet.deleteSheet(yourNewSheet);
  }

  yourNewSheet = activeSpreadsheet.insertSheet();
  yourNewSheet.setName(sheetName);


  var temp = Utilities.parseCsv(csv, '`');
  var contents = new Array(temp[0].length).fill(0).map(() => new Array(temp.length).fill(0));

  if(flip == "1"){
    for(var x = 0; x < temp.length; x++){
      for(var y = 0; y < temp[0].length-1; y++){
        contents[y][x] = temp[x][y];
      }
    }
  }else{
    contents = temp;
  }

  yourNewSheet.getRange(1, 1, contents.length,   contents[0].length).setValues(contents);

}
To aid in readability, I’ve also added some logic to make headings bold, and freeze certain rows and columns, based on the flip flag. I also auto-expand all columns to match the length of the data they contain.
function createSheetFromCSV(ssID, sheetName, csv, flip){

  var activeSpreadsheet = SpreadsheetApp.openById(ssID);

  var yourNewSheet = activeSpreadsheet.getSheetByName(sheetName);

  if (yourNewSheet != null) {
      activeSpreadsheet.deleteSheet(yourNewSheet);
  }

  yourNewSheet = activeSpreadsheet.insertSheet();
  yourNewSheet.setName(sheetName);


  var temp = Utilities.parseCsv(csv, '`');
  var contents = new Array(temp[0].length).fill(0).map(() => new Array(temp.length).fill(0));

  if(flip == "1"){
    for(var x = 0; x < temp.length; x++){
      for(var y = 0; y < temp[0].length-1; y++){
        contents[y][x] = temp[x][y];
      }
    }
  }else{
    contents = temp;
  }

  yourNewSheet.getRange(1, 1, contents.length,   contents[0].length).setValues(contents);


  if(flip == "1"){
    yourNewSheet.getRange(1,1,contents.length,1)
      .setFontSize(11)       // Sets size to 10 (has to be a number)
      .setFontWeight("bold");// Resets bold
    yourNewSheet.getRange(1,1,contents.length, contents[0].length).setNumberFormat("@");
  }else{
    yourNewSheet.getRange(1,1,1,contents[0].length)
      .setFontSize(11)       // Sets size to 10 (has to be a number)
      .setFontWeight("bold");// Resets bold
  }

  yourNewSheet.autoResizeColumns(1, contents[0].length)
  if(flip == "0"){
    yourNewSheet.setFrozenRows(1);
  }
  yourNewSheet.setFrozenColumns(1);

}
deleteDefaultSheet(id)
This simple function is just responsible for deleting the default sheet created with any blank workbook.
function deleteDefaultSheet(id){
  var ssFile = SpreadsheetApp.openById(id);
  var defaultSheet = ssFile.getSheetByName('Sheet1');
  ssFile.deleteSheet(defaultSheet);
}
injectDashboard(ssID)
The next step is to inject the dashboard sheet that will generate an easily digestible overview of the raw data we just imported. This dashboard is stored in another sample google sheet, but when copied, the formulas will point to the newly imported data on the fresh sheet. This system is also responsible for formatting the event logs, processes, and services sheets, as they require different formatting from the standard WMI objects.
To begin, we start by opening up the template workbook, copying the first sheet into our new workbook, and setting it as the first sheet. We’ll also add the current timestamp to a hidden cell to assist with some formulas, like calculating system uptime.
function injectDashboard(ssID){
  var ss = SpreadsheetApp.openById(ssID);
  var dashboardSheet = SpreadsheetApp.openById("XXXXXXXXXXXXXXXXXXXXXXXX").getSheets()[0];
  var newSheet = dashboardSheet.copyTo(ss);
  newSheet.setName("Overview");
  ss.setActiveSheet(newSheet);
  ss.moveActiveSheet(1);
  newSheet.getRange("J1").setValue(Utilities.formatDate(new Date(), "GMT-4", "MM/dd/yyyy HH:mm:ss"));
}
Then, we adjust the formatting of the non-WMI object sheets.
function injectDashboard(ssID){

  var ss = SpreadsheetApp.openById(ssID);
  var dashboardSheet = SpreadsheetApp.openById("XXXXXXXXXXXXXXXXXXXXXXXX").getSheets()[0];
  var newSheet = dashboardSheet.copyTo(ss);
  newSheet.setName("Overview");
  ss.setActiveSheet(newSheet);
  ss.moveActiveSheet(1);
  newSheet.getRange("J1").setValue(Utilities.formatDate(new Date(), "GMT-4", "MM/dd/yyyy HH:mm:ss"));
  var securityLog = ss.getSheetByName("SecurityEventLog");
  securityLog.getRange("H1").setFormula(`=QUERY(A1:F, "Select B, COUNT(C) where A is not null group by B pivot A", 1)`);
  securityLog.hideColumns(8,5);

  var appLog = ss.getSheetByName("ApplicationEventLog");
  appLog.getRange("H1").setFormula(`=QUERY(A1:F, "Select B, COUNT(C) where A is not null group by B pivot A", 1)`);
  appLog.hideColumns(8,5);

  var sysLog = ss.getSheetByName("SystemEventLog");
  sysLog.getRange("H1").setFormula(`=QUERY(A1:F, "Select B, COUNT(C) where A is not null group by B pivot A", 1)`);
  sysLog.hideColumns(8,5);
}
The Dashboard
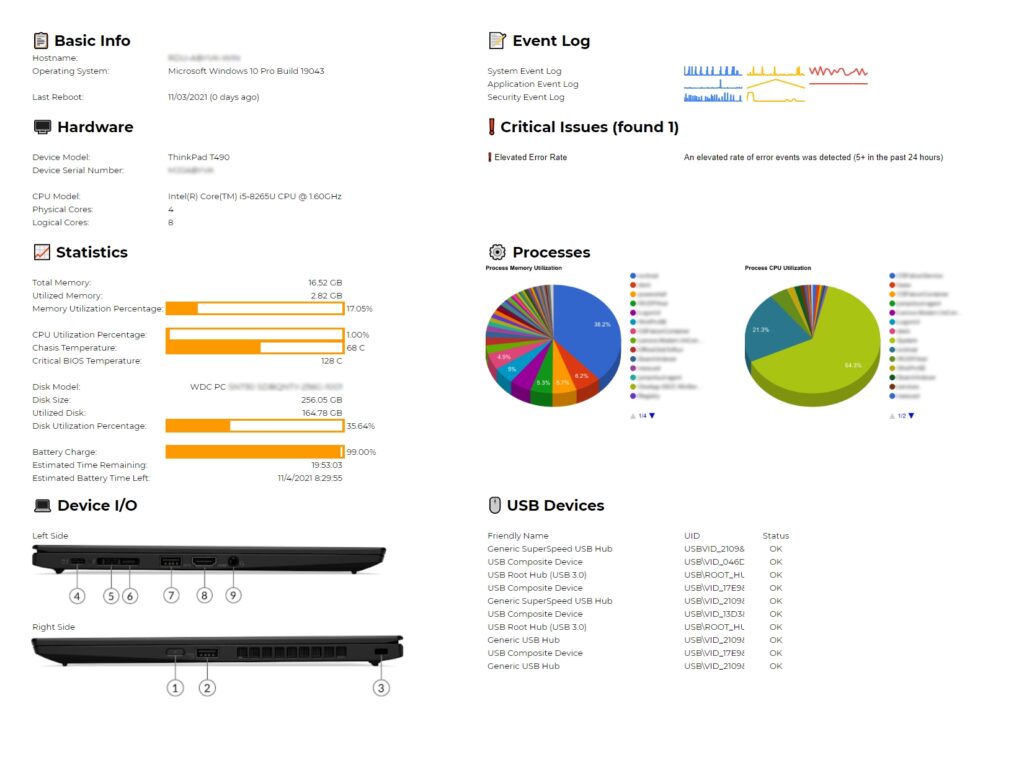
All of these disconnected sheets are great to get into the nitty-gritty diagnostics, like hunting through an event log- But a dashboard sheet can help automate all those common problems, and direct your attention in the correct direction right away. Let’s take a look at the final product before diving into the formulas needed to generate it.

The sheet utilizes a series of query statements to pull data from other sheets, no matter the format, or order of properties. We’ll begin by pulling some basic system info. We can do this using a simple formula.
=query(Win32_OperatingSystem!$A$1:$B, "SELECT B WHERE A='PSComputerName'", 0)This formula accesses a flipped table, meaning column A represents the name of a property of the only object in a given class, in this case “Win32_OperatingSystem“. It will pull the value in column B where column A (the property name) is “PSComputerName“.
We can continue to use this method to pull the remaining data in the right column. The “Last Reboot” section uses the report generation timestamp in the hidden cell (J1) to find the amount of time that has passed since the previous reboot timestamp.
Progress Bars
I knew I wanted some form of progress indicators to show current values against minimum and maximums, but unfortunately, Sheets does not have a progress bar formula. What it DOES have, however, is sparklines, which among a number of other useful features, allows for bar charts. Using this feature, some hidden cells to calculate inverse values, and setting custom bar colors, you can create a progress bar that can move to any value. An example can be seen in the statistics panel. Here is the formula for the memory utilization percentage bar.
=SPARKLINE(C20:C21,{"charttype","bar"; "color1", "orange"; "color2", "white"})Event Log Charts
Further utilizing sparklines, we can create line charts to show the rate of errors over time with the following formula. I inject extra query formulas into the event log sheets to format data that is compatible with sparklines.
=SPARKLINE(SystemEventLog!J2:J,{"linewidth",2})Automatic Problem Detector
On of my big goals with this project was to eliminate the process of looking for simple errors. So in hidden columns outside of the dashboard view, I created a table of different simple events to look for, such as:
- System has not been rebooted in over 10 days
- CPU load is greater than 80%
- Memory utilization is greater than 80%
- A dirty boot flag event was detected in the past 10 days
- An elevated level of error events are being logged (+5 in 24 hours)
In this table, I included a title, a formula that would return true or false based on if the condition for the problem was met, a severity level, and a description. In the dashboard, I use another query formula to list all issues whose formula column returned true, in the order of severity. This list will automatically update to show all configured issues in order of severity when the sheet is added to the diagnostic data workbook.
Device I/O
One especially nice feature is to show the sides of the device to see what IO is available on a given laptop. This is achieved with another table hidden in columns out of view, with a URL to images of each side of a device, and the model number. The dashboard formula simply performs a query lookup to that table based on the device model shown in the top dashboard section and feeds it into an IMAGE formula.
=IMAGE(QUERY(Q1:S, "SELECT P WHERE O = '"&$B$9&"' LIMIT 1"))USB Devices
Lastly, I pull all USB devices enumerated in CIM_USBDevice to a formatted table to show a full list of each USB device attached to the system. This is helpful for showing if a user may not have a keyboard and mouse connected to the system, for example. Future plans include performing a lookup to the VID and PID USB table to find the device name and manufacturer.
=QUERY(CIM_USBDevice!A2:D,"SELECT A, B, C LIMIT 10")Conclusion
This project has turned out to be incredibly useful, allowing us to gather and analyze data on any Windows machine in under 5 minutes. We are now able to diagnose quick issues before the user has a chance to generate further ticket load, or set aside additional time in their day to accommodate troubleshooting. Is it as good as a professional RMM? Absolutely not, but is it a suitable stopgap? Possibly. Please leave a comment below with any questions, and I’ll attempt to get back to you. Stay tuned for future posts, where I’ll show in detail how to use chrome extensions to integrate any product or service into any page, but for now happy hacking!

Pup Atlas, Chief Good Boy